So we've had a bit of a pullback in the stock market in recent weeks. We're going to look at three charts: the S&P 500, the S&P equal-weight, and the Russell small-cap.
First, the S&P 500:
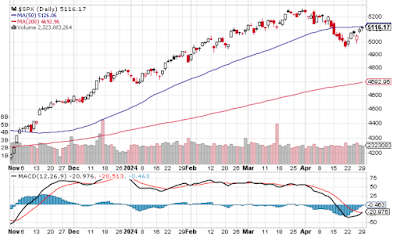
As we can see, this index has had a nice run in recent months. It broke through the 50-day moving average back in November and never fell below it, not even once, until mid-April. This month has seen it correct a bit, but it hasn't actually declined that much.
There are two interesting indicators on that chart: the 50-day moving average, and the MACD oscillator at the bottom. The 50-DMA is acting as resistance now, and indeed yesterday's trading action seems to have risen to that line and bounced off. That's a bearish sign. The other indicator is the MACD, and it clearly shows an oversold condition and an imminent signal line crossover. That's a bullish sign.
Which indicator will prove to be the stronger force? I don't know, but if the index fails to break through the 50-DMA this week, then it's probably heading further down.
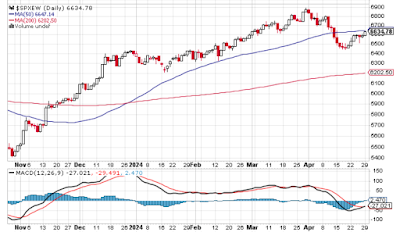
We see a similar pattern in the S&P equally-weighted index. It rose to the 50-DMA and then was stopped cold, signalling bear, while the MACD is signalling bull.
Also of note is that this version of the index hasn't risen as much as the $SPX version. That's because $SPX is heavily weighted towards a handful of giant companies that have shot up due to the AI craze. The equal-weight version isn't as AI-heavy, so its gain has been more modest.
And we see this difference even more clearly when we look just at small-caps. Here's the chart for the Russell 2000 ETF:
This index hasn't gone anywhere this calendar year. It's where it was back in December. The MACD is signalling the same thing it's signalling for the other charts, but the 50-DMA hasn't been tested yet. There's still some white space to cover before any bounce or breakthrough happens.
It's nearly May, and the old saying "sell in May and go away" must be considered as a possible influence on next month's action. There's also the inverted yield curve, a real estate index that peaked in December, banking troubles as a result of higher interest rates, and so on and so forth, all bearish. On the other hand, there are multiple powerful inflationary forces that might force prices higher, so the market might go up in spite of all the forces to the contrary. We should know over the next few weeks whether this pullback is just a consolidation or if it's the beginning of a serious correction.


No comments:
Post a Comment